Hochpassfilter – VB.Net Beispiel
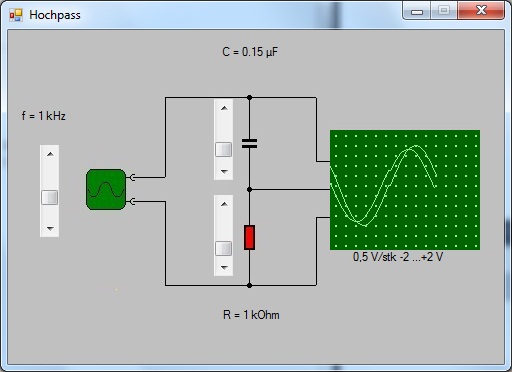
Das Programm stellt ein Zweikanal-Oszilloskop dar. Ein Sinusgenerator mit einstellbarer Frequenz und konstanter Amplitude liegt am Eingang des Tiefpassfilters und an einem Kanal des Oszilloskops. Die Sub ZeichnenSinb plottet den Sinus im Ausgabefenster
freq = (VScrollBarF.Maximum + VScrollBarF.Minimum – VScrollBarF.Value) / 10
u0 = 2
ZeichnenSinb(freq, 3, u0, 0.5, 0) ‚Eingangsspannung zeichnen
Der andere Kanal liegt am Ausgang des Filters. Die folgenden Rechnungen ermitteln die Ausgangsamplitude und die Phasenverschiebung. Die Ausgangsspannung wird entsprechend dieser Ergebnisse in einem zweiten Sinusgenerator gebildet.
‚Widerstand Rc
Xc = 1 / (f * 2 * Math.PI * c)
‚Ur berechnen
z = Math.Sqrt(r * r + Xc * Xc)
ur = (u0 * r) / z
‚Phasenverschiebung berechnen
phasev = (Math.Acos(ur / u0)) * 180 / Math.PI
‚Ur zeichnen
ZeichnenSin(freq, 3, ur, 0.5, phasev)
Eine weitere Besonderheit dieses Programm ist, dass zwei Spannungsverläufe gleichzeitig angezeigt werden, nämlich die Eingangsspannung und die Spannung am Widerstand R. Möglich wurde dies, indem ich die Prozedur SinZeichnen kopiert und die benutzten Variablen variiert habe (zeichnenSinb). Im Timer kann so nacheinander die eine oder die andere Prozedur aufgerufen werden, ohne dass sich die Werte gegenseitig beeinflussen.
Public Class frmHochPass
Dim pixelx, pixely
Dim pixelxb, pixelyb
Dim vt, vtb
Dim ugrund, uv
Dim P1 As Point
Dim pz As Point
Dim P2 As Point
Dim P1b As Point
Dim pzb As Point
Dim P2b As Point
Dim stiftl As New Pen(Color.LightGreen, 1)
Private Sub pSet(ByVal x As Integer, ByVal y As Integer)
P1.X = x
P1.Y = y
pz.X = 1
pz.Y = 1
Dim vsize As New Size(pz)
Dim rect As New Rectangle(P1, vsize)
PictureBox1.CreateGraphics.DrawRectangle(Pens.LightGreen, rect) ‚, P1) ‚, P1)
End Sub
Private Sub Line(ByVal x As Integer, ByVal y As Integer)
P2.X = x
P2.Y = y
PictureBox1.CreateGraphics.DrawLine(stiftl, P1, P2)
P1.X = x
P1.Y = y
End Sub
Private Sub pSet2(ByVal x As Integer, ByVal y As Integer)
P1b.X = x
P1b.Y = y
pzb.X = 1
pzb.Y = 1
Dim vsize As New Size(pz)
Dim rect As New Rectangle(P1b, vsize)
PictureBox1.CreateGraphics.DrawRectangle(Pens.LightGreen, rect) ‚, P1) ‚, P1)
End Sub
Private Sub Line2(ByVal x As Integer, ByVal y As Integer)
P2b.X = x
P2b.Y = y
PictureBox1.CreateGraphics.DrawLine(stiftl, P1b, P2b)
P1b.X = x
P1b.Y = y
End Sub
Private Sub Timer1_Tick(ByVal sender As System.Object, ByVal e As System.EventArgs) Handles Timer1.Tick
Dim freq, u0, ur, r, Xc, phasev, f, z
Dim c As Double
freq = (VScrollBarF.Maximum + VScrollBarF.Minimum – VScrollBarF.Value) / 10
u0 = 2
ZeichnenSinb(freq, 3, u0, 0.5, 0) ‚Eingangsspannung zeichnen
‚Widerstand R
r = ((VScrollBarR.Maximum + VScrollBarR.Minimum) – VScrollBarR.Value) * 1000
c = ((VScrollBarC.Maximum + VScrollBarC.Minimum) – VScrollBarC.Value) * (10 ^ -8)
f = freq * 1000
‚Widerstand Rc
Xc = 1 / (f * 2 * Math.PI * c)
‚Ur berechnen
z = Math.Sqrt(r * r + Xc * Xc)
ur = (u0 * r) / z
‚Phasenverschiebung berechnen
phasev = (Math.Acos(ur / u0)) * 180 / Math.PI
‚Ur zeichen
ZeichnenSin(freq, 3, ur, 0.5, phasev)
End Sub
Private Sub ZeichnenSin(ByVal f As Double, ByVal u0 As Integer, ByVal umax As Double, ByVal dime As Double,ByVal phase As Double)
Dim xvt, i, ut
‚Grundspannung
If pixelx = 0 Then
For i = 0 To 14
For j = 0 To 11
pSet(5 + (i * 10), (j * 10) + 5)
Next j
Next i
pSet(0, pixely)
End If
‚X Koordinaten +1, mit Reset
pixelx = pixelx + 2
If pixelx >= 150 Then
PictureBox1.Image = Nothing
pixelx = 0
End If
‚Zeit des Sinus
‚Herzangabe Frequenz bei Timer = 20ms
vt = vt + (7.2 * f)
If vt >= 361 Then vt = 0
xvt = Math.PI * ((vt + phase) / 180.0)
‚Ut kurz vor der Ausgabe. UV muss berechnet werden
ut = u0 + (Math.Sin(xvt)) * umax
pixely = 115 – ut * (10 / dime) ‚*20 denn 1v = 2 Kästchen
If pixely > 115 Then pixely = 115
If pixely < 5 Then pixely = 5
Line(pixelx, pixely)
End Sub
Private Sub ZeichnenSinb(ByVal f As Double, ByVal u0 As Integer, ByVal umax As Double, ByVal dime As Double,ByVal phase As Double)
Dim xvtb, i, ut
pixelxb = pixelxb + 2
If pixelxb >= 150 Then
PictureBox1.Image = Nothing
pixelxb = 0
End If
‚Herzangabe Frequenz bei Timer = 20ms
vtb = vtb + (7.2 * f)
If vtb >= 361 Then vtb = 0
xvtb = Math.PI * ((vtb + phase) / 180.0)
ut = u0 + (Math.Sin(xvtb)) * umax
pixelyb = 115 – ut * (10 / dime) ‚*20 denn 1v = 2 kästchen
If pixelyb > 115 Then pixelyb = 115
If pixelyb < 5 Then pixelyb = 5
Line2(pixelxb, pixelyb)
End Sub
Private Sub VScrollBarF_Scroll(ByVal sender As System.Object, ByVal e AsSystem.Windows.Forms.ScrollEventArgs) Handles VScrollBarF.Scroll
lbF.Text = „f = “ + Str((VScrollBarF.Maximum + VScrollBarF.Minimum – VScrollBarF.Value) / 10) + “ kHz“
End Sub
Private Sub VScrollBarC_Scroll(ByVal sender As System.Object, ByVal e AsSystem.Windows.Forms.ScrollEventArgs) Handles VScrollBarC.Scroll
lbC.Text = „C = “ + Str((VScrollBarC.Maximum + VScrollBarC.Minimum – VScrollBarC.Value) / 100) + “ µF „
End Sub
Private Sub VScrollBarR_Scroll(ByVal sender As System.Object, ByVal e AsSystem.Windows.Forms.ScrollEventArgs) Handles VScrollBarR.Scroll
lbR.Text = „R = “ + Str(VScrollBarR.Maximum + VScrollBarR.Minimum – VScrollBarR.Value) + “ kOhm“
End Sub
Private Sub frmHochPass_Load(ByVal sender As System.Object, ByVal e As System.EventArgs) HandlesMyBase.Load
End Sub
End Class
Download Projektdatei
Wenn Sie nur an der Exe-Datei interessiert sind, befindet sich diese in dem Unterordner \bin\Debug.